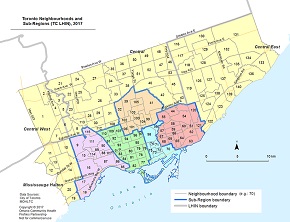
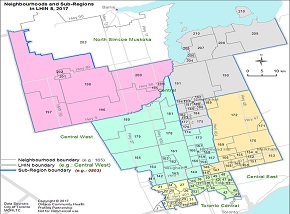
Ontario Neighbourhoods | Neighbourhoods in City of Toronto | Neighbourhoods in Central LHIN |
||
|---|---|---|---|---|

|
|
|
||
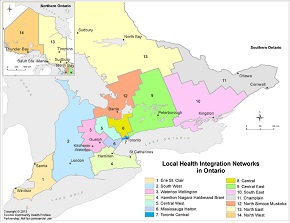
| Ontario Sub-Regions | Ontario Local Health Integration Networks (LHINs) | |||

|
|
Archived Data — Ontario Sub-Regions
Select the Data Topic Category, Level of Geography and Year for which you would like to download archived data table (EXCEL format) or map (PDF).
Archived Ontario Geographic Level
| Data Topic Category | Ontario Geographic Level | ||||||
|---|---|---|---|---|---|---|---|
| Neighbourhoods | Sub-Regions | LHINs | Maps | ||||
| Individual Neighb. (PDF) |
All Neighb. (EXCEL) |
Individual Sub-Region (EXCEL) |
All Sub-Regions (EXCEL) |
Individual LHIN (PDF) |
All LHINs (EXCEL) |
All Geographic Levels Maps (PDF) |
|
| Census-based population denominators | 2011 | 2011 | 2011 | ||||
| Socio-demographic, Census Canada | |||||||
| Population and Age, Living Alone, Family Composition, Language | 2011 | 2011 | All Maps | ||||
| Ontario Marginalization | |||||||
| • Material Deprivation • Residential Instability • Dependency • Ethnic Concentration |
20116 | All Maps | |||||
| Prevention | |||||||
| • Mammograms • Pap smears • Any Colorectal Cancer Screening • Colonoscopy • Fecal Occult Blood Testing |
2013/15 | 2013/15 | 2013/15 | All Maps | |||
| Emergency Department (ED) Care | |||||||
| • All Emergency Department (ED) visits • ED visits by High Urgency • ED visits by Low Urgency |
2014/15 | 2014/15 | 2014/15 | All Maps | |||
| Adult Health and Disease | |||||||
| • Diabetes • Asthma • High Blood Pressure • Mental Health and Addiction-related Visits • Chronic Obstructive Pulmonary Disease |
2014/15 | 2014/15 | 2014/15 | All Maps | |||
| 2+ Chronic Condition | 2016/17 | ||||||
| 4+ Chronic Condition | 2015/17 | ||||||
| Hospital Admissions | |||||||
| Ambulatory Care Sensitive Conditions (ACSC) Hospitalizations | 2014/16 | 2014/16 | |||||
| Data Topic Category | Archived Ontario Geographies no longer in use (from 2017) | ||||
|---|---|---|---|---|---|
| Health Links | Sub-LHINs (in LHIN 7 and LHIN 8) | Maps | |||
| Individual Health Link (PDF) |
All Health Link (EXCEL) |
Individual Sub-LHIN (EXCEL) |
All Sub-LHINs (EXCEL) |
Archived Health Links Maps (PDF) |
|
| Census-based population denominators | 2011 | ||||
| Socio-demographic | 2011 | ||||
| Primary Care | |||||
| Primary Care: Enrolment and Continuity of Care | 2011/13 | 2011/13 | All Maps | ||
| Emergency Department Care | |||||
| • All Emergency Department (ED) visits • ED visits by High Urgency • ED visits by Low Urgency |
2014/15 | 2014/15 | All Maps | ||
| Prevention | |||||
| • Mammograms • Pap smears • Any Colorectal Cancer Screening • Colonoscopy • Fecal Occult Blood Testing |
2013/15 | 2013/15 | All Maps | ||
| Adult Health and Disease | |||||
| • Diabetes • Asthma • High Blood Pressure • Mental Health and Addiction-related Visits • Chronic Obstructive Pulmonary Disease |
2014/15 | 2014/15 | All Maps | ||
| Children and Youth | |||||
| Asthma |
2014/15 | 2014/15 | |||
| Archived Geographic Boundaries and Contextual Maps | |||||
Health Links in Ontario LHIN 7 (Toronto Central) map, 2013 List of Ontario Health Links, 2016 |
|||||
Archived Maps — Socio-demographic indicators (Ontario LHINs) 
MAP TYPES:
Rate Ratio [RR] Natural Breaks data classification [NB] Population-Weighted Quintiles data classification [PWQ]
Dot Density [DD] Local Indicator of Spatial Association [LISA] Overlay Maps [OM]
See How to Read the Maps for more information on these and other types of maps.
Rate Ratio [RR] Natural Breaks data classification [NB] Population-Weighted Quintiles data classification [PWQ]
Dot Density [DD] Local Indicator of Spatial Association [LISA] Overlay Maps [OM]
See How to Read the Maps for more information on these and other types of maps.
| Percent change in population count | LHINs: 2006-2011 |
| Population 19 and Under | LHINs: 2011 [NB] |
| Population 65 and Over | LHINs: 2011 [NB] |
| Persons 65 and Older Living Alone | LHINs: 2011 [NB] |
| Lone Parent Families | LHINs: 2011 [NB] |
| Percent of population 15 years and over married or living with a common-law partner | LHINs: 2011 [NB] |
| Percentage of population 15 years and over not married and not living with a common-law partner | LHINs: 2011 [NB] |
| Percentage of population 15 years and over not married and not living with a common-law partner - single (never legally married) | LHINs: 2011 [NB] |
| Population Without Knowledge of Official Languages | LHINs: 2011 [NB] |
Archived Maps — Prevention indicators (Ontario LHINs)
MAP TYPES:
Rate Ratio [RR] Natural Breaks data classification [NB] Population-Weighted Quintiles data classification [PWQ]
Dot Density [DD] Local Indicator of Spatial Association [LISA] Overlay Maps [OM]
See How to Read the Maps for more information on these and other types of maps.
Rate Ratio [RR] Natural Breaks data classification [NB] Population-Weighted Quintiles data classification [PWQ]
Dot Density [DD] Local Indicator of Spatial Association [LISA] Overlay Maps [OM]
See How to Read the Maps for more information on these and other types of maps.
| Age-Standardized rate of Mammography Among Women 50-69 | LHINs: 2013/15 [NB] |
| Age-Standardized rate of Pap Smears Among Women 21-69 | LHINs: 2012/15 [NB] |
| Age-Standardized rate of Any Colorectal Cancer Screening, Both Sexes, Age 50-74 | LHINs: 2015 [NB] |
| Age-Standardized rate of Colonoscopy Screening, Both Sexes, Age 50-74 | LHINs: 2005/15 [NB] |
| Age-Standardized rate of Fecal occult blood testing (FOBT) Screening, Both Sexes, Age 50-74 | LHINs: 2013/15 [NB] |
Archived Maps — Emergency Department Care indicators (Ontario LHINs)
MAP TYPES:
Rate Ratio [RR] Natural Breaks data classification [NB] Population-Weighted Quintiles data classification [PWQ]
Dot Density [DD] Local Indicator of Spatial Association [LISA] Overlay Maps [OM]
See How to Read the Maps for more information on these and other types of maps.
Rate Ratio [RR] Natural Breaks data classification [NB] Population-Weighted Quintiles data classification [PWQ]
Dot Density [DD] Local Indicator of Spatial Association [LISA] Overlay Maps [OM]
See How to Read the Maps for more information on these and other types of maps.
| All Emergency Department (ED) visits | |
| Age-Standardized rate of ED visits per 1,000 population, Total Population, All Ages 0+, Both Sexes | LHINs: 2014/15 [NB] |
| Age-Standardized % of the population with one or more ED visits, Total Population, All Ages 0+, Both Sexes | LHINs: 2014/15 [NB] |
| All Emergency Department (ED) visits that are High Urgency | |
| Age-Standardized rate of ED visits per 1,000 population that are High Urgency, Total Population, All Ages 0+, Both Sexes | LHINs: 2014/15 [NB] |
| Age-Standardized % of ED visits that are High Urgency, Total Population, All Ages 0+, Both Sexes | LHINs: 2014/15 [NB] |
| All Emergency Department (ED) visits that are Low Urgency | |
| Age-Standardized rate of ED visits per 1,000 population that are Low Urgency, Total Population, All Ages 0+, Both Sexes | LHINs: 2014/15 [NB] |
| Age-Standardized % of ED visits that are Low Urgency, Total Population, All Ages 0+, Both Sexes | LHINs: 2014/15 [NB] |
Archived Maps — Adult Health and Disease indicators (Ontario LHINs)
MAP TYPES:
Rate Ratio [RR] Natural Breaks data classification [NB] Population-Weighted Quintiles data classification [PWQ]
Dot Density [DD] Local Indicator of Spatial Association [LISA] Overlay Maps [OM]
See How to Read the Maps for more information on these and other types of maps.
Rate Ratio [RR] Natural Breaks data classification [NB] Population-Weighted Quintiles data classification [PWQ]
Dot Density [DD] Local Indicator of Spatial Association [LISA] Overlay Maps [OM]
See How to Read the Maps for more information on these and other types of maps.
| Diabetes, All Ages 20+, Both Sexes | LHINs: 2014/15 [NB] |
| Asthma, All Ages 20+, Both Sexes | LHINs: 2014/15 [NB] |
| High Blood Pressure, All Ages 20+, Both Sexes | LHINs: 2014/15 [NB] |
| Mental Health Visits, All Ages 20+, Both Sexes | LHINs: 2014/15 [NB] |
| Chronic Obstructive Pulmonary Disease (COPD), All Ages 35+, Both Sexes | LHINs: 2014/15 [NB] |
Archived Maps — Primary Care indicators (Ontario Health Links)
MAP TYPES:
Rate Ratio [RR] Natural Breaks data classification [NB] Population-Weighted Quintiles data classification [PWQ]
Dot Density [DD] Local Indicator of Spatial Association [LISA] Overlay Maps [OM]
See How to Read the Maps for more information on these and other types of maps.
Rate Ratio [RR] Natural Breaks data classification [NB] Population-Weighted Quintiles data classification [PWQ]
Dot Density [DD] Local Indicator of Spatial Association [LISA] Overlay Maps [OM]
See How to Read the Maps for more information on these and other types of maps.
| Primary Care Enrolment and Continuity indicators | |
| % of Population Non-Enrolled in Primary Care among Total Population 19+ | Health Links: 2013 [NB] |
| Non-Enrolled Population in Primary Care, Both Sexes, Age 19+ | Health Links: 2013 [NB] |
| % of Population with no Primary Care Visits among Total Population 19+ | Health Links: 2013 [NB] |
| Population with no Primary Care Visits, Both Sexes, Age 19+ | Health Links: 2013 [NB] |
| % of Population with Low Continuity of Care among All Enrolled and Non-Enrolled Population with 3+ Visits within two years, Both Sexes, Age 19+ | Health Links: 2013 [NB] |
| Population with Low Continuity of Care among Population with 3+ Visits within two years, Both Sexes, Age 19+ | Health Links: 2013 [NB] |
| % of Population Non-Enrolled in Primary Care and with no Primary Care Visits among Total Population 19+ | Health Links: 2013 [NB] |
| Population Non-Enrolled in Primary Care and with no Primary Care Visits, Both Sexes, Age 19+ | Health Links: 2013 [NB] |
| % of Non-Enrolled Population with Low Continuity in Primary Care among All Enrolled and Non-Enrolled Population with 3+ Visits within two years, Both Sexes, Age 19+ | Health Links: 2013 [NB] |
| Non-Enrolled Population with Low Continuity in Primary Care among Non-Enrolled Population with 3+ Visits within two years, Both Sexes, Age 19+ | Health Links: 2013 [NB] |
Archived Maps — Emergency Department Care indicators (Ontario Health Links)
MAP TYPES:
Rate Ratio [RR] Natural Breaks data classification [NB] Population-Weighted Quintiles data classification [PWQ]
Dot Density [DD] Local Indicator of Spatial Association [LISA] Overlay Maps [OM]
See How to Read the Maps for more information on these and other types of maps.
Rate Ratio [RR] Natural Breaks data classification [NB] Population-Weighted Quintiles data classification [PWQ]
Dot Density [DD] Local Indicator of Spatial Association [LISA] Overlay Maps [OM]
See How to Read the Maps for more information on these and other types of maps.
| All Emergency Department (ED) visits | |
| Age-Standardized rate of ED visits per 1,000 population, Total Population, All Ages 0+, Both Sexes | Health Links: 2014/15 [NB] |
| Age-Standardized % of the population with one or more ED visits, Total Population, All Ages 0+, Both Sexes | Health Links: 2014/15 [NB] |
| All Emergency Department (ED) visits that are High Urgency | |
| Age-Standardized rate of ED visits per 1,000 population that are High Urgency, Total Population, All Ages 0+, Both Sexes | Health Links: 2014/15 [NB] |
| Age-Standardized % of ED visits that are High Urgency, Total Population, All Ages 0+, Both Sexes | Health Links: 2014/15 [NB] |
| All Emergency Department (ED) visits that are Low Urgency | |
| Age-Standardized rate of ED visits per 1,000 population that are Low Urgency, Total Population, All Ages 0+, Both Sexes | Health Links: 2014/15 [NB] |
| Age-Standardized % of ED visits that are Low Urgency, Total Population, All Ages 0+, Both Sexes | Health Links: 2014/15 [NB] |
Archived Maps — Prevention indicators (Ontario Health Links)
MAP TYPES:
Rate Ratio [RR] Natural Breaks data classification [NB] Population-Weighted Quintiles data classification [PWQ]
Dot Density [DD] Local Indicator of Spatial Association [LISA] Overlay Maps [OM]
See How to Read the Maps for more information on these and other types of maps.
Rate Ratio [RR] Natural Breaks data classification [NB] Population-Weighted Quintiles data classification [PWQ]
Dot Density [DD] Local Indicator of Spatial Association [LISA] Overlay Maps [OM]
See How to Read the Maps for more information on these and other types of maps.
| Age-Standardized rate of Mammography Among Women 50-69 | Health Links: 2013/15 [NB] |
| Age-Standardized rate of Pap Smears Among Women 21-69 | Health Links: 2012/15 [NB] |
| Age-Standardized rate of Any Colorectal Cancer Screening, Both Sexes, Age 50-74 | Health Links: 2015 [NB] |
| Age-Standardized rate of Colonoscopy Screening, Both Sexes, Age 50-74 | Health Links: 2005/15 [NB] |
| Age-Standardized rate of Fecal occult blood testing (FOBT) Screening, Both Sexes, Age 50-74 | Health Links: 2013/15 [NB] |
Archived Maps — Adult Health and Disease indicators (Ontario Health Links)
MAP TYPES:
Rate Ratio [RR] Natural Breaks data classification [NB] Population-Weighted Quintiles data classification [PWQ]
Dot Density [DD] Local Indicator of Spatial Association [LISA] Overlay Maps [OM]
See How to Read the Maps for more information on these and other types of maps.
Rate Ratio [RR] Natural Breaks data classification [NB] Population-Weighted Quintiles data classification [PWQ]
Dot Density [DD] Local Indicator of Spatial Association [LISA] Overlay Maps [OM]
See How to Read the Maps for more information on these and other types of maps.
| Diabetes, All Ages 20+, Both Sexes | Health Links: 2014/15 [NB] |
| Asthma, All Ages 20+, Both Sexes | Health Links: 2014/15 [NB] |
| High Blood Pressure, All Ages 20+, Both Sexes | Health Links: 2014/15 [NB] |
| Mental Health Visits, All Ages 20+, Both Sexes | Health Links: 2014/15 [NB] |
| Chronic Obstructive Pulmonary Disease (COPD), All Ages 35+, Both Sexes | Health Links: 2014/15 [NB] |
|
|
|
|


|
|
|