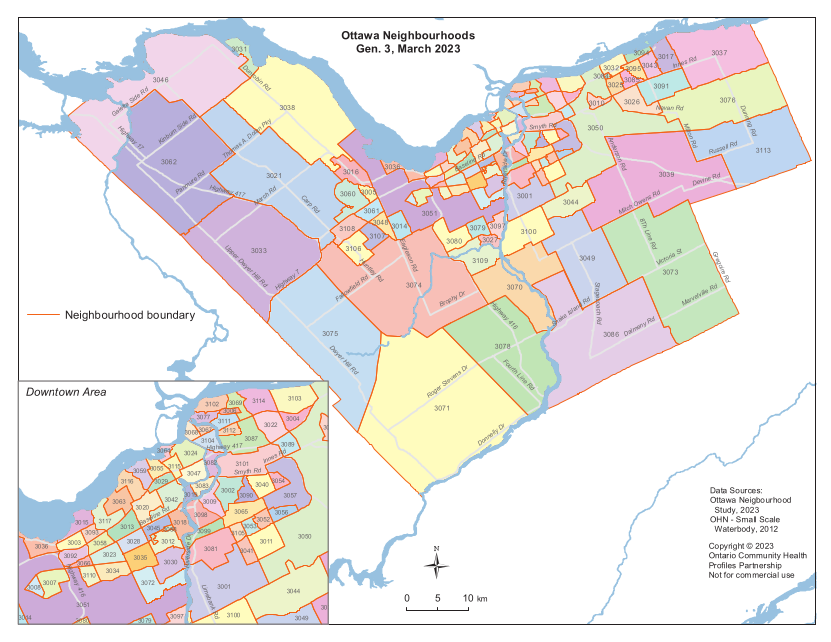
Neighbourhoods in City of Ottawa |
Neighbourhoods in City of Toronto |
Local Areas in OH Central |
||||
|---|---|---|---|---|---|---|
|

|

|
||||
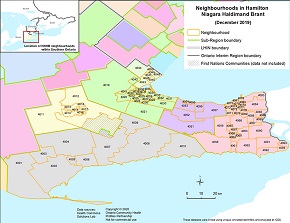
Neighbourhoods in Hamilton Niagara Haldimand Brant |
Neighbourhoods in South West | Neighbourhoods in Erie St. Clair | ||||
|

|

|
||||
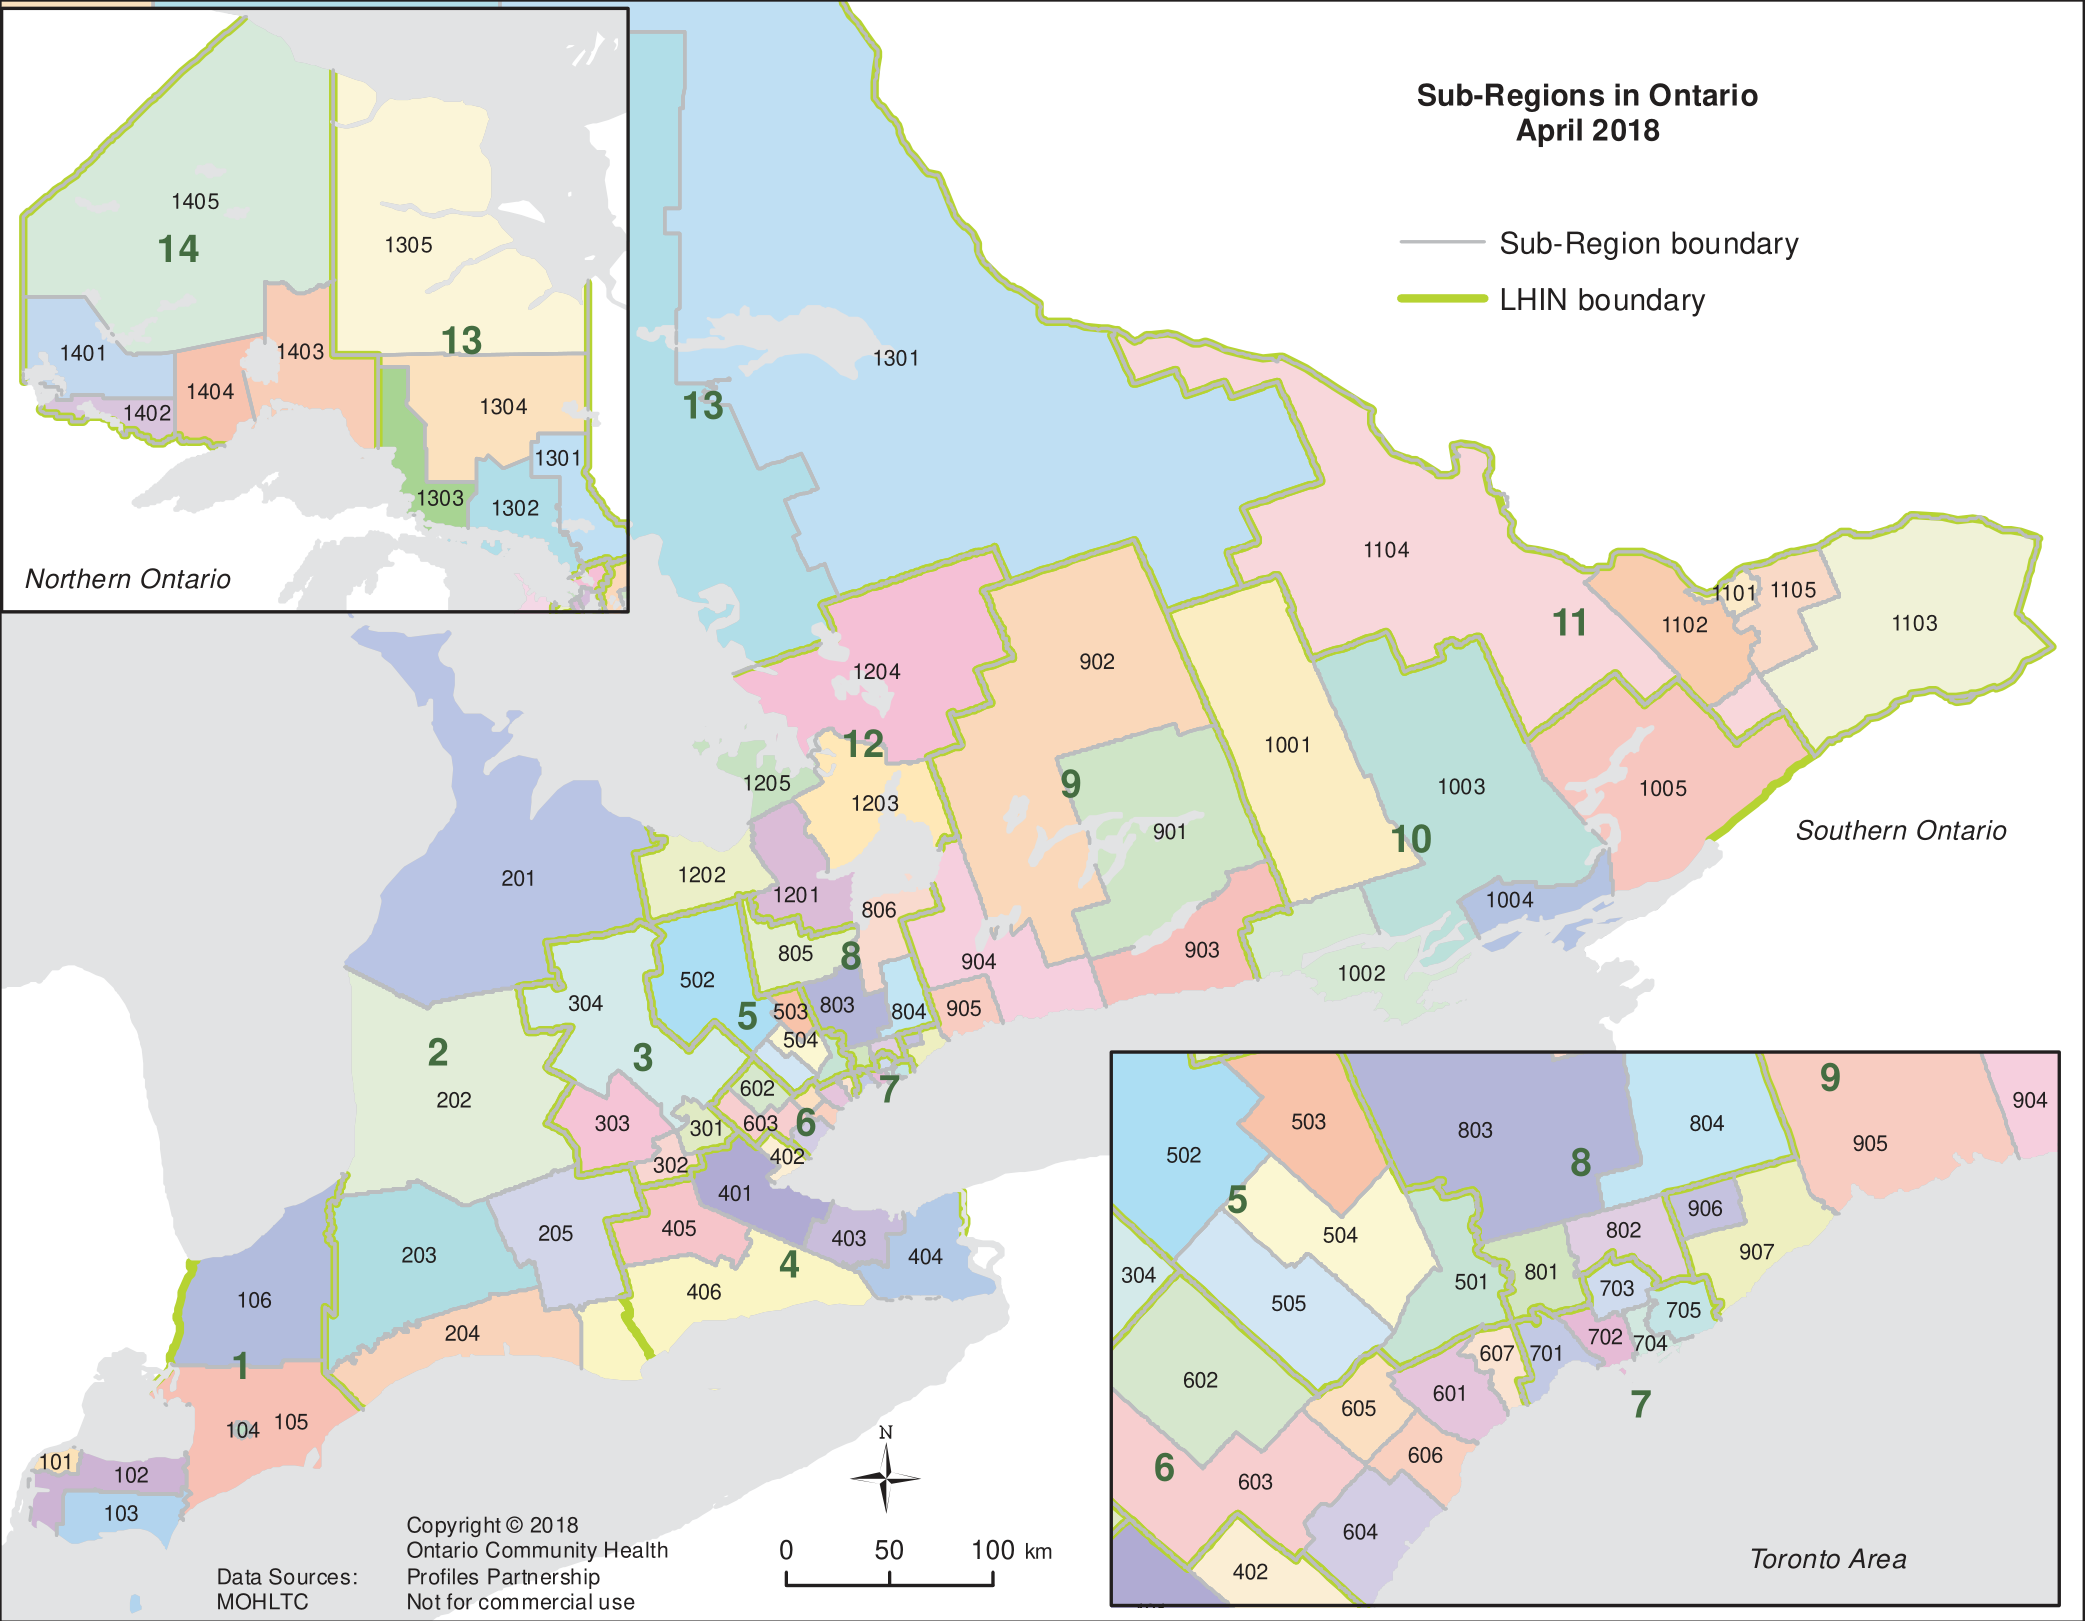
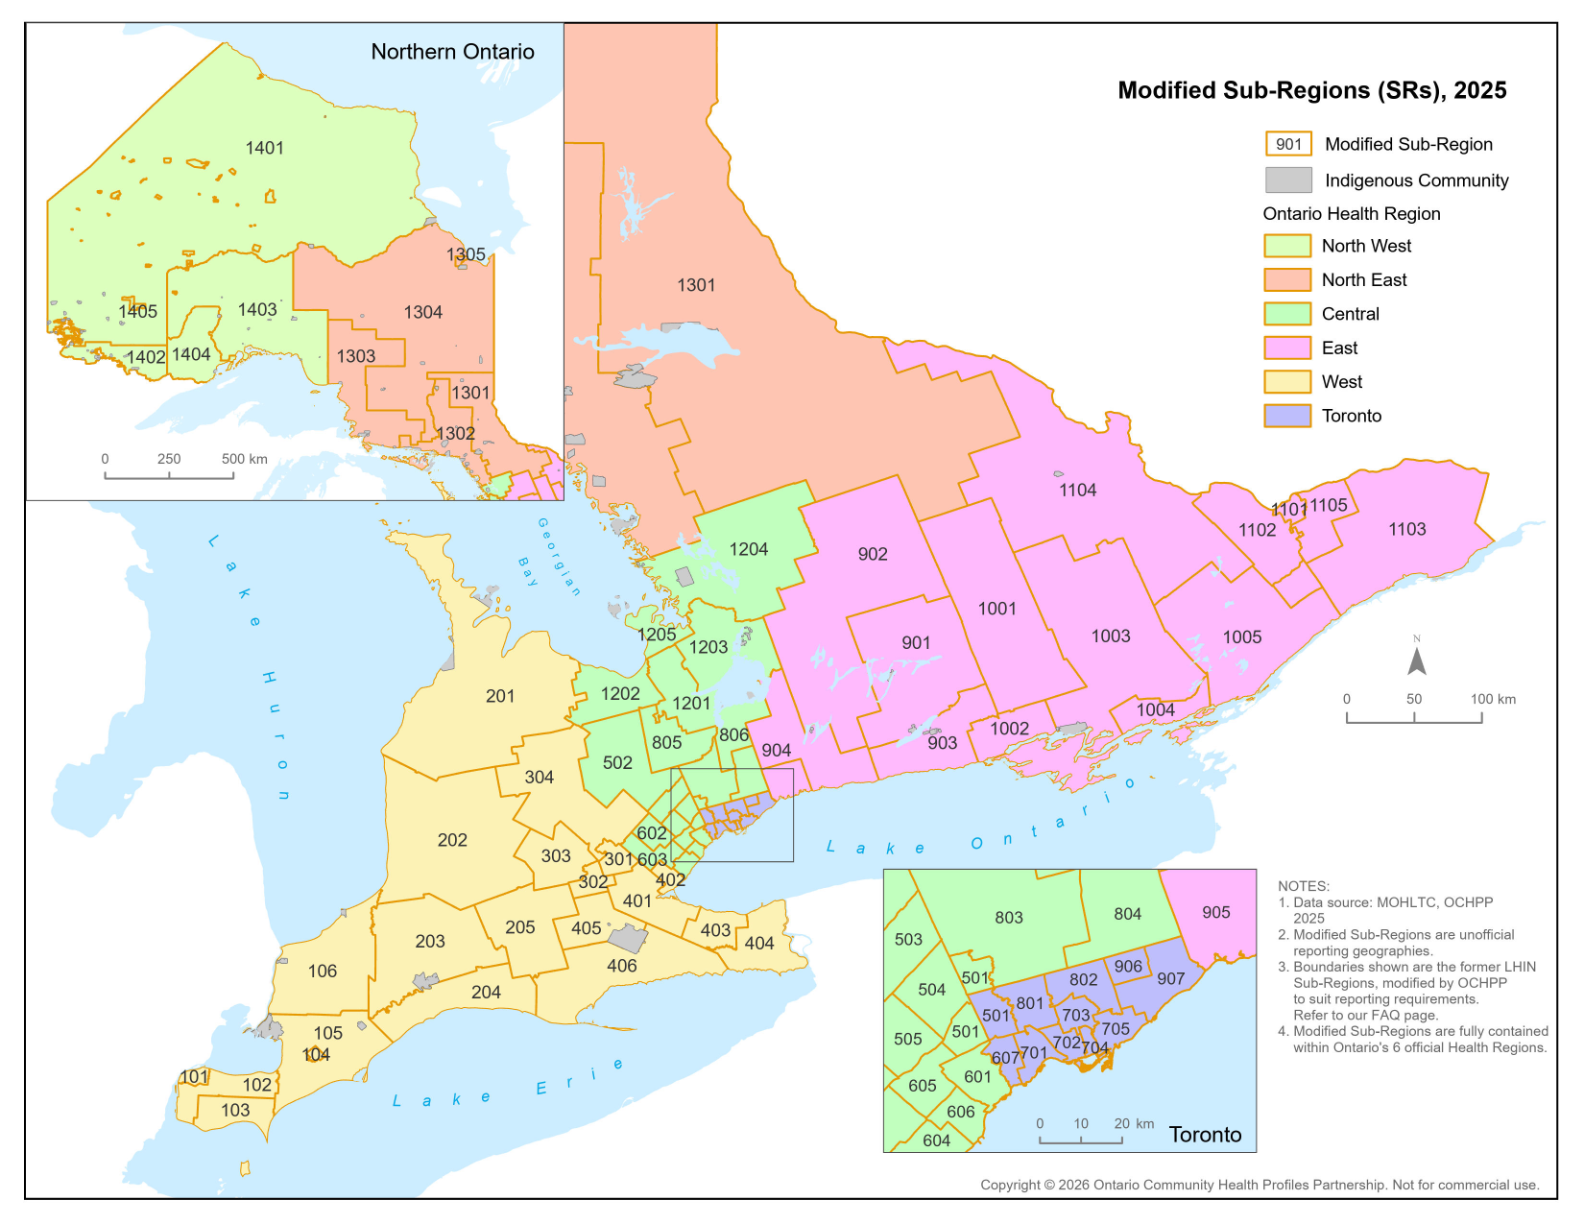
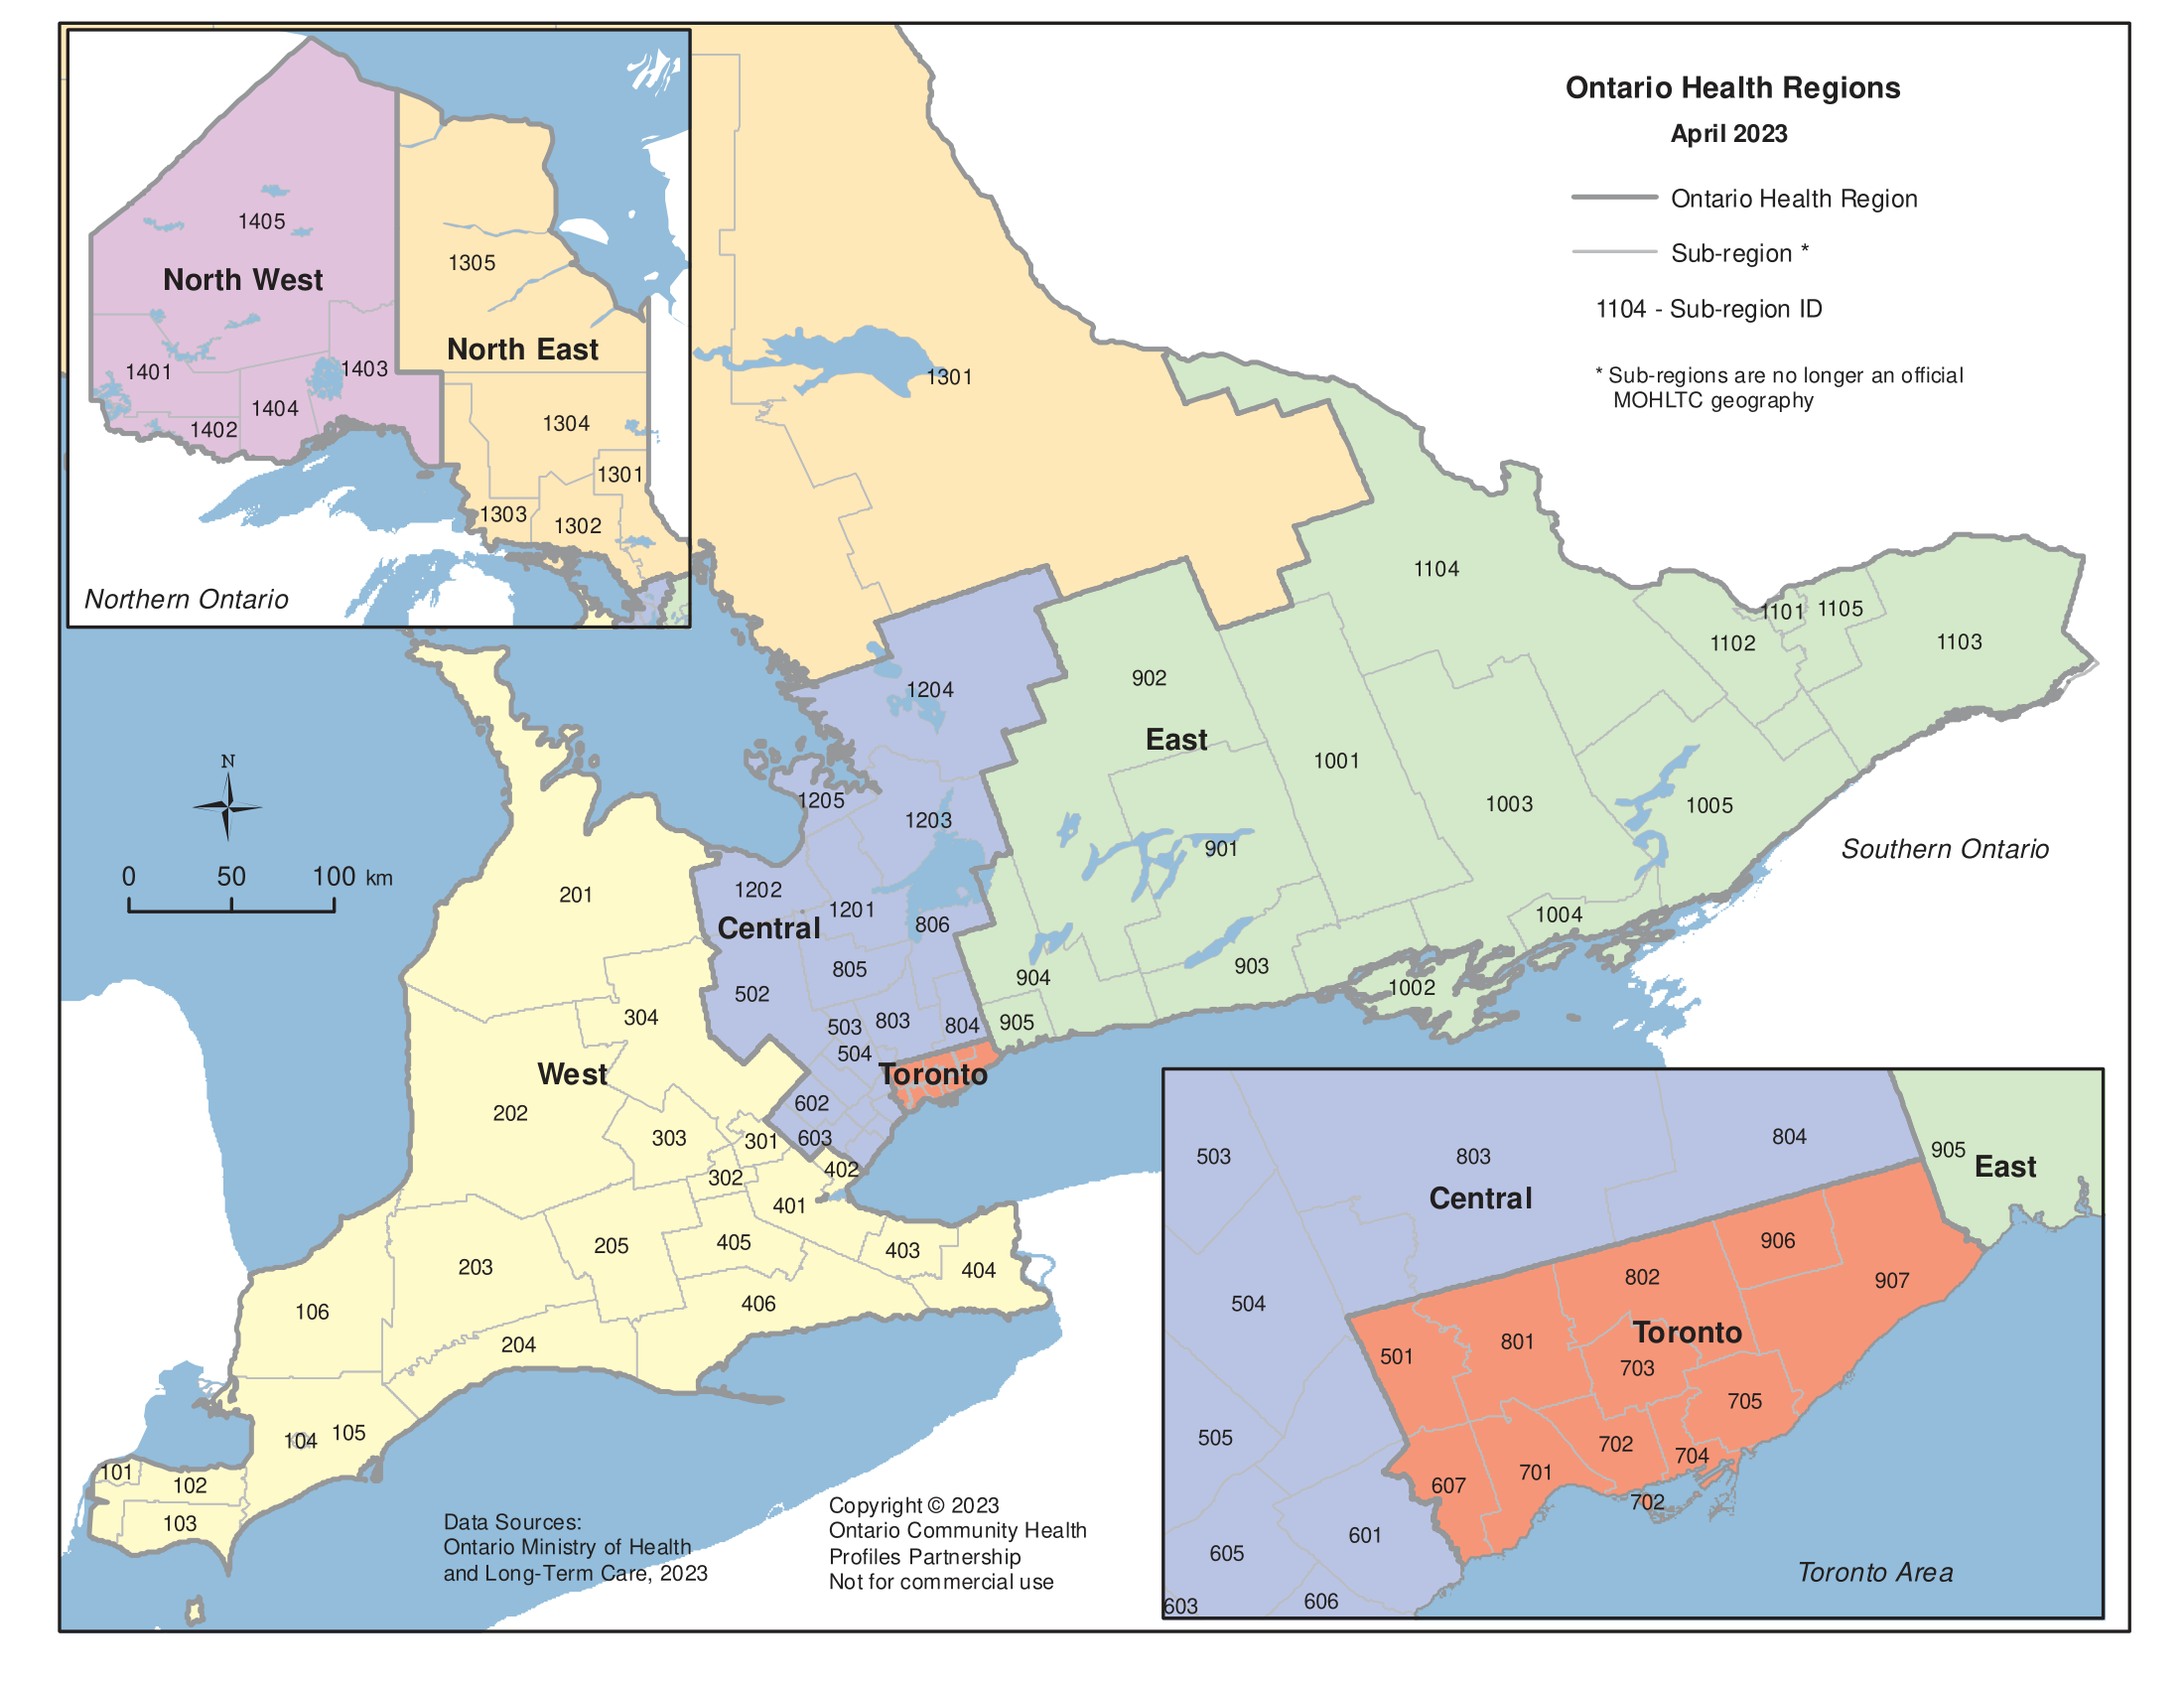
| Ontario Sub-Regions | Modified Sub-Regions | Ontario Health Regions | ||||
|
|
|
||||
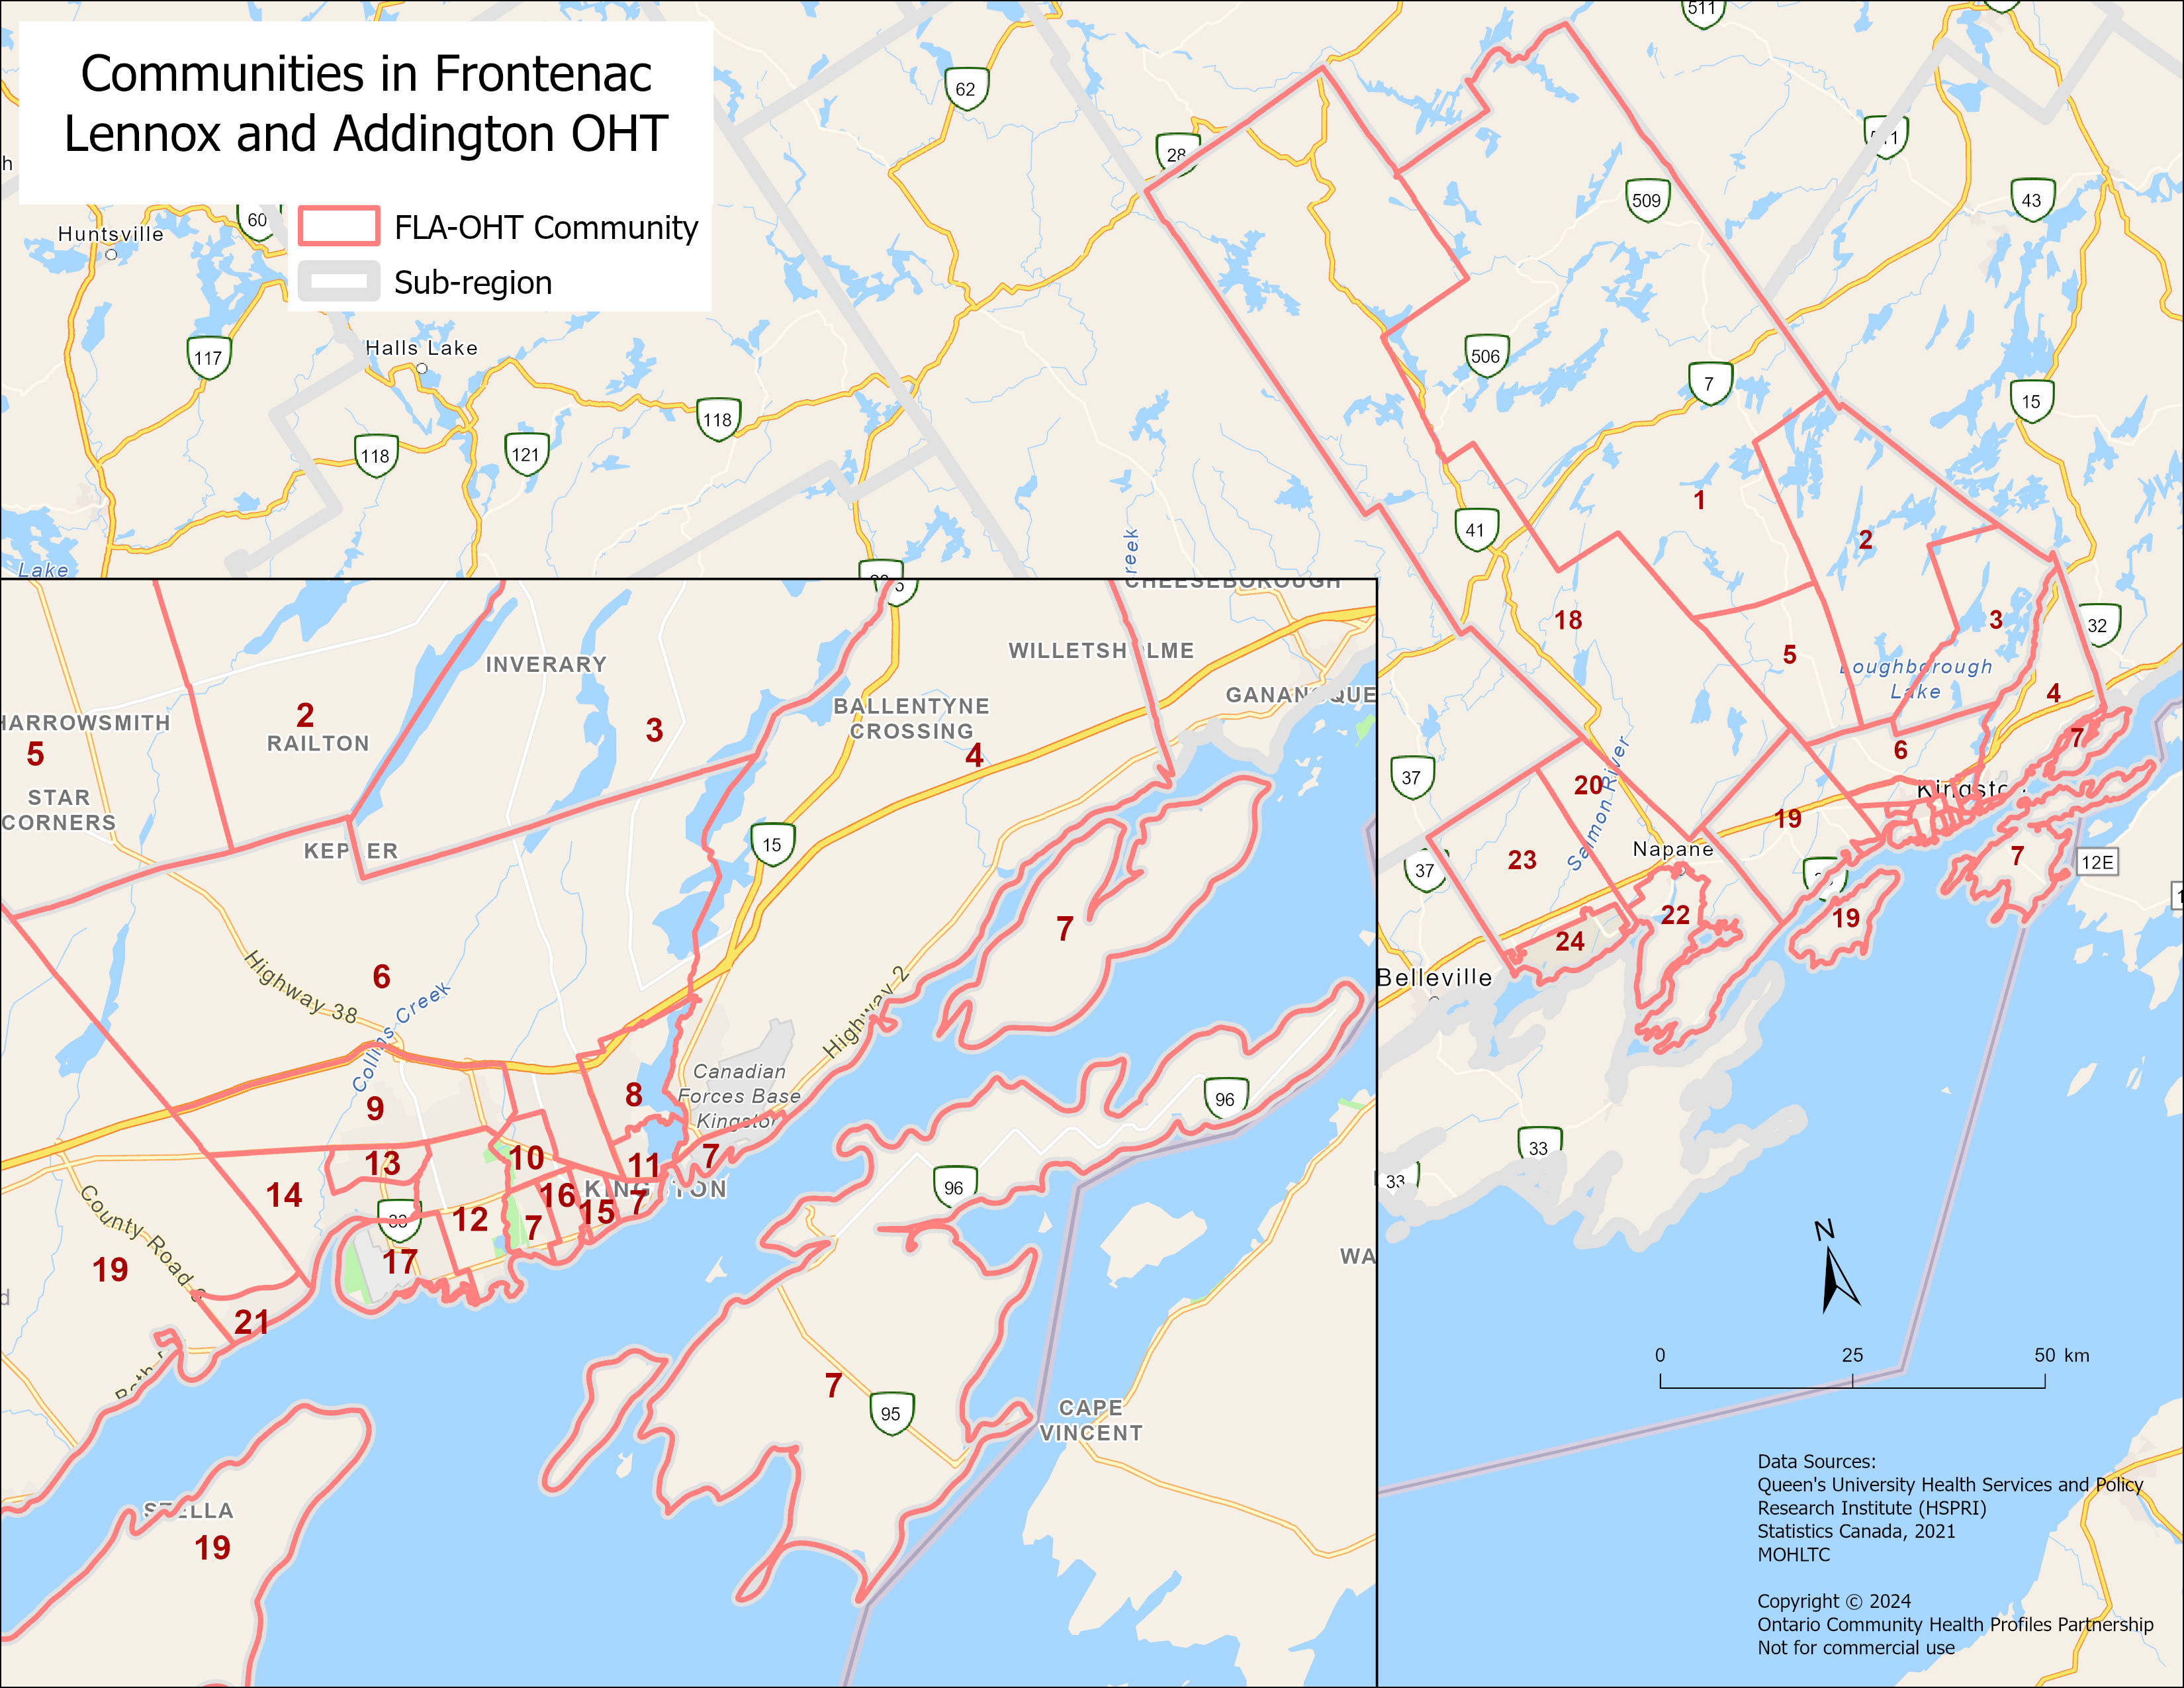
| Frontenac Lennox and Addington – OHT | Durham Health Neighbourhoods | |||||
|

|
Data — Ontario Sub-Regions
Select the Data Topic Category and Year for which you would like to download Data table (EXCEL format), Bar Charts and Maps (PDF format).
| Data Topic Category | Ontario Sub-Regions | ||
|---|---|---|---|
| Tables | Charts | Maps | |
| (EXCEL) | (BAR CHARTS) | (PDF) | |
| Census-based population denominators | 2016 | ||
| Census Variables | |||
| Socio-demographic, Census Canada 2016 | |||
| Income for Persons, Households, and Economic Families | 2016 | ||
| Persons in Low Income — Market Basket Measure (MBM) | 2016 | ||
| Population in Private Households: Living Alone and Activities of Daily Living |
2016 | ||
| Visible Minority, Mobility Status, Immigrant Status, Employment, Housing Suitability, Education | 2016 | ||
| Language Spoken Most Often at Home | 2016 | ||
| Lone-Parent Families | 2016 | ||
| Ontario Marginalization Index | |||
| • Material Deprivation • Residential Instability • Dependency • Ethnic Concentration |
2016 | ||
| Registered Persons Database (RPDB)-based population denominators | 2023, 2022 | ||
| Adult Health Indicators | Tables | Charts | Maps |
| Primary Care | |||
| Attachment to Primary Care | |||
| Prevention | |||
| Pap smears | 2018/20 | ||
| Adult Health and Disease | |||
| Diabetes | 2021/22, 2018/19 | 2021/22 | |
| Asthma |
2021/22 | 2021/22 | |
| High Blood Pressure |
2021/22 | 2021/22 | |
| Mental Health and Addiction-related Visits |
2023 |
|
2023 |
| Chronic Obstructive Pulmonary Disease |
2022/23 | 2022/23 | |
| 2+ Chronic Conditions |
2022/23, 2018/19 | 2022/23 | |
| 4+ Chronic Conditions |
2021/23, 2017/19 |
|
2021/23 |
| Emergency Department (ED) Care Visits Indicators | Tables | Charts | Maps |
| Emergency Department Care | |||
| • All Emergency Department (ED) visits • ED visits by High Urgency (HU) • ED visits by Low Urgency (LU) |
2021/23 ^^, 2018/20 | ||
| Mental Health and Addiction-related ED visits | 2021/23, 2018/20 | ||
| Hospital Related Conditions Indicators | Tables | Charts | Maps |
| Hospital Admissions | |||
| All Hospital Admissions | 2021/23, | ||
| Medical Hospital Admissions | 2021/23 | ||
| Surgical Hospital Admissions | 2021/23 | ||
| Mental Health and Addiction-related Hospital Admissions | 2021/23 | ||
| Ambulatory Care Sensitive Conditions (ACSC) Hospitalizations | 2021/23 | ||
| Tables | Charts | Maps | |
Due to limitations, data may not always be provided in table or map form. Bar charts will not be updated. If you require a specific format not available on OCHPP, contact us at healthprofiles@unityhealth.to
The data posted on OCHPP reflects the most up-to-date available from our sources. For older data and maps, see our Archives page.
The data posted on OCHPP reflects the most up-to-date available from our sources. For older data and maps, see our Archives page.

